No single weather event can be attributed to climate change, but a warming climate does load the dice in favor of heavier extreme precipitation events. (Dr. Jeff Masters)
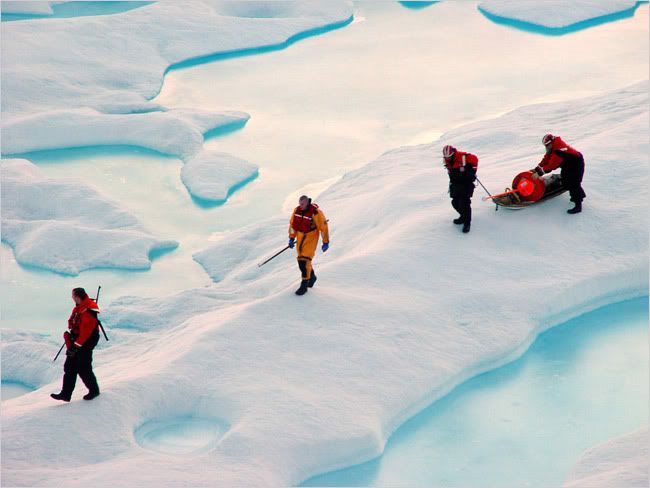
Arctic Sea Ice & Climate Change
So what do you think is going to happen to the polar ice this year? As global temps are on the rise, it appears to be on it's way to a record low. CK the link:
NSIDC. Go to the icon in the lower right named Arctic Sea Ice News & Analysis to see the current ice extent. It's updated daily. The blue line is what is happening now, the dotted line is the record low of 2007.
2009
As we address climate change, we are running out of easy to get fossil fuels and are forced to draw more from unconventional ones. "Shell and others want to turn to tar, and extract oil from coal. But these are very carbon-intensive processes, and will deepen the climate problem" (Dr. Legget). Indeed, "The tar sands of Canada will make a nonsense of any climate change agreement" (Steve Connor).
2010 - The Alberta Tar Sands
"The reserves - 171.8 billion barrels - 13% of the global total and are about what Iraq and Russia have, combined...But it isn't really oil, it's bitumen... Producing a barrel of oil... creates more then twice the emissions of old-school drilling" (Daniel Gross, Newsweek 14 June 2010, p29) "The need for a proposed $7 billion [2000-mile Keystone XL pipeline] that they say will bring "dirty oil" from Canadian oil sands to U.S. refineries and significantly increase the country's reliance on fossil fuels." (Ayesha Rascoe)
Anthropogenic Forcing
The principle pollutants
Water Vapor Feedback 36 - 72%
During the fall under a clear night sky in New England, the temperature drops as the heat of the day escapes into space, giving way to a frosty morning. But if there is cloud cover, the heat is trapped and the temperature remains elevated. Classic example of the green house effect of water vapor.
The Clausius-Clapeyron relation states that air can hold more water vapor per unit volume when it warms. It is a dynamic equilibrium between both the vapor phase and liquid phase. The equilibrium is where gas the same number of gas molecules are combining and condensing to form a liquid as there are liquid phase molecules evaporating to form a gas. When the temperature increases, the molecules in both the liquid and gas phases have more kinetic energy making it more difficult for gas-phase molecules to condense to form a liquid and easier for liquid-phase molecules to evaporate, so to balance out, the concentration of water vapor increases until a new equilibrium is reached. Currently water vapor is about 2% of the atmosphere.
The positive heat-amplifying effect of water vapor will double the climate warming caused by increased levels of carbon dioxide in the atmosphere (Andrew Dessler). So if there is a 1°C change caused by CO2, the water vapor will cause the temperature to go up another 1°C. If the Earth warms 1.8 °F, the increase in water vapor will trap an extra 2 Watts of energy per square meter (NASA).
"The increase of global ocean temperatures of 0.5°C over the past 50 years has put 4% more water vapor unto the atmosphere since 1970" (Masters)
CO2 9 - 26%
Joseph Fourier, 1820s, observed that gases in the atmosphere might trap the heat received from the Sun. It was noted that if the earth were an ideal back body averaging 150 million km from the sun, it would have a temperature of about 5.3 °C. However, the Earth reflects about 28 - 30% of the incoming sunlight, so the effective temperature should only be −18 or −19 °C. But it was found that the average surface temperature of the earth is about 15°C or about 33°C above what it should be because of the infrared absorption of water vapo r and CO2. Most of the short UV, visible, and near IR radiation from the sun passes through the atmosphere without being absorbed. 50% is taken in at the Earth's surface which re-radiates it as longer IR thermal radiation which then gets absorbed in the atmosphere. Some makes its way back to the ground as downward long wave radiation, reducing the amount of heat that escapes into space. This is called the natural greenhouse effect.
Svante Arrhenius, 1896, notes that fossil fuel combustion may eventually result in enhanced global warming. G.S. Callendar, 1938, observed that the level of carbon dioxide was climbing and raising global temperature. Currently, CO2 is about one in every 4000 molecules of air. Before 1750, before James Watt invented the steam engine, CO2 in the atmosphere was 280ppm. By 1900 it was 300ppm. Today - 390ppm. Yearly CO2 emissions are now at around 30 Gt. 20 years from now, it's projected to be 50 Gt.
The Keeling Curve
In 1958, Dr. Keeling developed a curve showing the increase of CO2 concentration, parts per million by volume(ppmv), from measurements made at the top of Mauna Loa in Hawai at 3,397 meters. It has been monitored continuously since then. Before the industrial era and during much of the
Holocene, atmospheric CO2 concentration was between 275 and 280 parts ppmv. By the year 2000 it had risen to 367ppmv, and by 2008, 385ppmv; an annual increase of about 2ppm per year. The rate of change is abut 0.3% a year. Annual 5ppmv dips in the graph are caused when trees leaf out and farmlands green, where growth and photosynthesis take some of the CO2 out of the air. When they decay in the fall, some of the CO2 is re-released back into the atmosphere. To keep climate change below 2°C, it is calculated that we must keep the level below 450ppm, a difficult proposition considering the rate of increase we have today.
Anual mean growth rate of CO2 at Maunoa Loa
Each Country's Share of CO2 Emissions
Country, Total Emissions (Million Metric Tons of CO2), Per Capita Emissions (Tons/Capita)
- China, 6534, 4.91
- United States, 5833, 19.18
- Russia, 1729, 12.29
- India, 1495, 1.31
- Japan, 1214, 9.54
- Germany, 829, 10.06
- Canada, 574, 17.27
- United Kingdom, 572, 9.38
- South Korea, 542, 11.21
- Iran, 511, 7.76
Data: Union of Concerned Scientists, 2008
Yearly CO2 Emissions in millions of tons: EIA
1980 - 18,488.253
1990 - 21,677.327
2000 - 23,876.592
2008 - 30,377.313
Methane 4 - 9%
Ozone 3 - 7%
The Science
Weather Anomalies
Videos
Other Climate Change Links
Oil:
Glossary
Green House Effect- Natural About 80-90% of the Earth's natural greenhouse effect is due to water vapor. The remainder is due to carbon dioxide, methane, and a few other gases.
- Man-Made The addition of greenhouse gases from the burning of fossil fuels
Clausius-Clapeyron equation
The phase transition between two states of matter, such as solid and liquid. On a pressure-temperature (P-T) diagram, the line separating the two phases is known as the coexistence curve. The Clausius-Clapeyron relation gives the slope of this curve. Gives the slope of the vapor pressure curve. "All known substances in the two-phase region fulfill the Clausius-Clapeyron equation provides the general validity of the 1st and 2nd laws of thermodynamics" (MIT)
The Milanković Curve
Radiation curve for high latitudes were dominated by the 41,000-year oscillation of the earth-sun distance tilt cycle, the cycle at the equator being 22,00 years
The Tyndall effect
The longer-wavelength light is more transmitted while the shorter-wavelength light is more reflected via scattering.
Back to
Mathematics
")
")
")
")
")
")
")
")
")
")
")
")


 Threaded Mode